Student Right-to-Know Information (Consumer Information)
Federal law requires public posting of data and information about graduation and retention rates, costs and financial aid, various policies and procedures, and other information that will help students make good choices about their higher education plans. This page includes some of the specific data required by the Student-Right-to-Know law, and other information about policies and procedures is on the page entitled Inventory of Trinity Compliance with Federal Regulations.
IPEDS Graduation and Retention Rates
Students who enroll as first-time full-time undergraduates in Trinity’s College of Arts and Sciences become a federally-determined cohort for tracking “graduation rate” data. The system through which Trinity must report this data to the federal government is know as IPEDS (the Integrated Postsecondary Education Data System). Federal law requires the posting of the IPEDS graduation rate overall, and by ethnicity and gender. Trinity’s IPEDS data is below; note that the cohorts are 100% female:

Tuition and Financial Aid
2025 EADA (Equity in Athletics) Survey
Verification of Identity in Distance Education
Placement and Employment Rates
Periodically, Trinity conducts surveys of our graduates to determine employment and satisfaction. The most recent survey occurred in Fall 2019. The results of the 2019 survey reveal that:
- 95% of Trinity’s graduates across the last 20 years are employed; those who are not employed largely report that they are caretakers for children or elders, engaged in volunteer service or retired.
- $65,000 is the median salary reported by graduates of the decade 2010 to 2019;
- $80,000 is the median salary reported by graduates of the decade 2000 to 2009;
- $80,000 is the median salary for all graduates across all decades;
- 94% of all graduates report that they are satisfied or “very” satisfied with their Trinity education.
Licensure Pass Rates
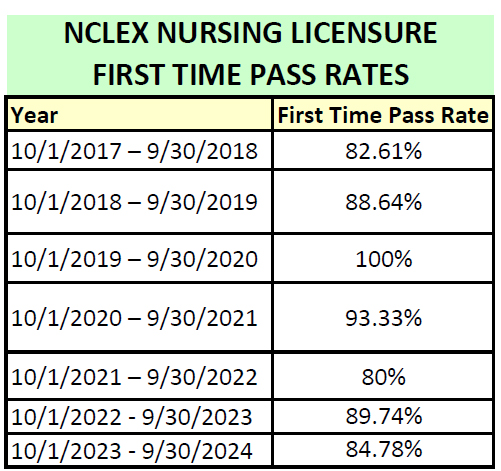
(For more on Nursing at Trinity visit the Nursing home page)
Masters in Occupational Therapy NBCOT Pass Rates
2021: 96%
2022: 90%
2023: 91%
2024: 88%
(For more on Occupational Therapy at Trinity visit the MOT web page)
Student Loan Borrowers and Indebtedness
Trinity’s Office of Enrollment Services works with undergraduate financial aid applicants to maximize grants and scholarships in their financial aid offers. Students may also borrow from the Federal Direct Student Loan program to meet costs of education not covered by grants and scholarships. In the 2024-2025 academic year, 61% of graduate students and 42% of undergraduate students borrowed federal student loans. 32% of students who earned a Bachelor’s degree in 2024-2025 did not borrow any federal student loans. For the students who did borrow, their average indebtedness was $24,360.
Cohort Default Rate
A cohort default rate is the percentage of a school’s borrowers in the U.S. who enter repayment on their federal student loans during a fiscal year and default within the cohort default period. The Department of Education calculates the school’s Cohort Default Rate (CDR).
| Cohort | Trinity’s Default Rate | National Average Rate |
| 2018 | 8.7% | 7.3% |
| 2019 | 4.0% | 2.3% |
| 2020 | 0.0% | 0.0% |
| 2021 | 0.0% | 0.0% |
| 2022 | 0.0% | 0.0% |
| USDE IPEDS 5 YEAR MEDIAN SALARIES – DC COMPARISONS | ||||
| INSTITUTION | CIP | SELECT PROGRAM COMPARISONS | DEGREE | 5 Yr Median |
| American University | 901 | Communication and Media Studies. | Master’s Degree | 104844 |
| Trinity Washington University | 901 | Communication and Media Studies. | Master’s Degree | 73997 |
| George Washington University | 901 | Communication and Media Studies. | Bachelor’s Degree | 68982 |
| Trinity Washington University | 1312 | Teacher Education and Professional Development, Specific Levels and Methods. | Master’s Degree | 80918 |
| Howard University | 1312 | Teacher Education and Professional Development, Specific Levels and Methods. | Master’s Degree | 72832 |
| American University | 1312 | Teacher Education and Professional Development, Specific Levels and Methods. | Master’s Degree | 66942 |
| George Washington University | 1312 | Teacher Education and Professional Development, Specific Levels and Methods. | Master’s Degree | 66280 |
| George Washington University | 4201 | Psychology, General. | Bachelor’s Degree | 73005 |
| Georgetown University | 4201 | Psychology, General. | Bachelor’s Degree | 70574 |
| American University | 4201 | Psychology, General. | Bachelor’s Degree | 62657 |
| The Catholic University of America | 4201 | Psychology, General. | Bachelor’s Degree | 61999 |
| Trinity Washington University | 4227 | Research and Experimental Psychology. | Bachelor’s Degree | 59760 |
| University of the District of Columbia | 4201 | Psychology, General. | Bachelor’s Degree | 58850 |
| Howard University | 4201 | Psychology, General. | Bachelor’s Degree | 55395 |
| George Washington University | 4301 | Criminal Justice and Corrections. | Bachelor’s Degree | 73045 |
| Howard University | 4301 | Criminal Justice and Corrections. | Bachelor’s Degree | 63116 |
| American University | 4301 | Criminal Justice and Corrections. | Bachelor’s Degree | 61582 |
| Trinity Washington University | 4301 | Criminal Justice and Corrections. | Bachelor’s Degree | 55994 |
| Strayer University-District of Columbia | 4301 | Criminal Justice and Corrections. | Bachelor’s Degree | 54929 |
| Georgetown University | 5202 | Business Administration, Management and Operations. | Bachelor’s Degree | 95328 |
| American University | 5202 | Business Administration, Management and Operations. | Bachelor’s Degree | 88921 |
| The Catholic University of America | 5202 | Business Administration, Management and Operations. | Bachelor’s Degree | 79779 |
| Howard University | 5202 | Business Administration, Management and Operations. | Bachelor’s Degree | 74786 |
| University of the District of Columbia | 5202 | Business Administration, Management and Operations. | Bachelor’s Degree | 69464 |
| Trinity Washington University | 5202 | Business Administration, Management and Operations. | Bachelor’s Degree | 66987 |
| Strayer University-District of Columbia | 5202 | Business Administration, Management and Operations. | Bachelor’s Degree | 63174 |
| Georgetown University | 5202 | Business Administration, Management and Operations. | Master’s Degree | 175402 |
| George Washington University | 5202 | Business Administration, Management and Operations. | Master’s Degree | 154789 |
| American University | 5202 | Business Administration, Management and Operations. | Master’s Degree | 131517 |
| Howard University | 5202 | Business Administration, Management and Operations. | Master’s Degree | 126336 |
| Trinity Washington University | 5202 | Business Administration, Management and Operations. | Master’s Degree | 99031 |
| Strayer University-District of Columbia | 5202 | Business Administration, Management and Operations. | Master’s Degree | 72657 |
| Howard University | 5138 | Registered Nursing, Nursing Administration, Nursing Research and Clinical Nursing. | Bachelor’s Degree | 105029 |
| Trinity Washington University | 5138 | Registered Nursing, Nursing Administration, Nursing Research and Clinical Nursing. | Bachelor’s Degree | 97649 |
| The Catholic University of America | 5138 | Registered Nursing, Nursing Administration, Nursing Research and Clinical Nursing. | Bachelor’s Degree | 94074 |
| George Washington University | 5138 | Registered Nursing, Nursing Administration, Nursing Research and Clinical Nursing. | Bachelor’s Degree | 91325 |
| Georgetown University | 5138 | Registered Nursing, Nursing Administration, Nursing Research and Clinical Nursing. | Bachelor’s Degree | 84741 |
| George Washington University | 1311 | Student Counseling and Personnel Services. | Master’s Degree | 63921 |
| Trinity Washington University | 1311 | Student Counseling and Personnel Services. | Master’s Degree | 61040 |

Inventory of Trinity Compliance with Federal Regulations
To review all Trinity policies related to federal compliance, visit the compliance page below: